Case Studies
Real projects, real outcomes.
See how we have helped Australian organisations transform their reporting. Names changed to protect client confidentiality.
National Distribution Company
Queensland
Weekly reporting consumed 12+ hours across the operations team. Sales and warehouse data lived in separate systems, leading to constant disputes about stock levels and delivery performance. Management decisions were based on week-old data.
Root Cause
No unified data model. Each department maintained their own spreadsheets with different definitions of 'on-time delivery' and 'stock availability'. Manual data exports created a 5-7 day lag.
What We Built
Built a centralised data model connecting their ERP, WMS, and sales systems. Implemented automated daily refreshes with clear metric definitions agreed by all stakeholders. Created role-specific dashboards for warehouse managers, sales team, and executives.
Outcomes
- Reporting time dropped from 12 hours to under 30 minutes
- Single source of truth eliminated cross-team disputes
- Real-time inventory visibility improved stock allocation
- Management now reviews live data in weekly meetings
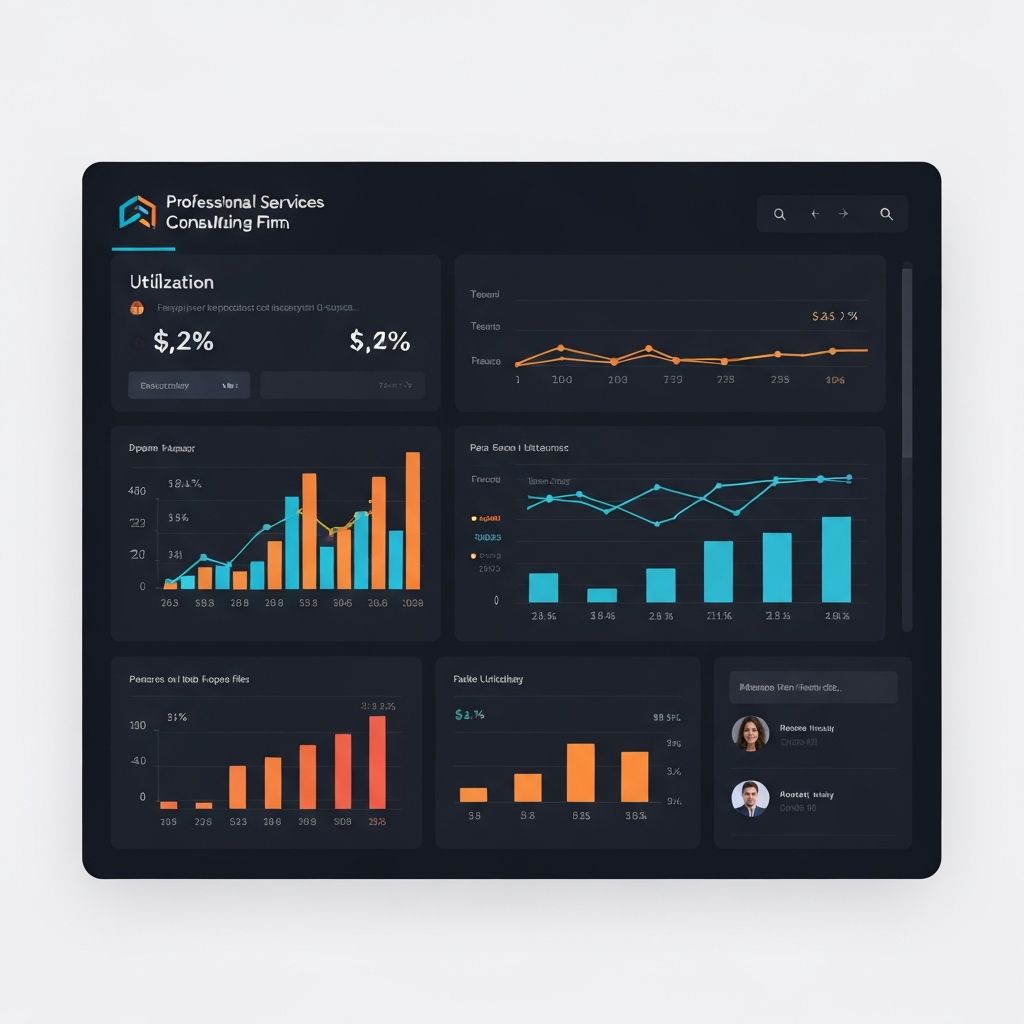
Queensland Professional Services Firm
Brisbane
Partners relied on gut feel for resource allocation across 200+ staff. Utilisation reports were 2-3 weeks old by the time they reached decision-makers. Project profitability was only known after completion.
Root Cause
Time tracking data was captured but never properly modelled. No connection between timesheet system, project management, and billing. Finance team spent days each month manually reconciling data.
What We Built
Connected timesheet, project management, and billing systems into a unified model. Built live utilisation dashboards with drill-through to individual projects and staff. Created profitability views that update as time is logged.
Outcomes
- Live utilisation visibility across all 200+ staff
- Project profitability known during delivery, not after
- Resource allocation decisions based on current data
- Finance reconciliation time reduced by 80%
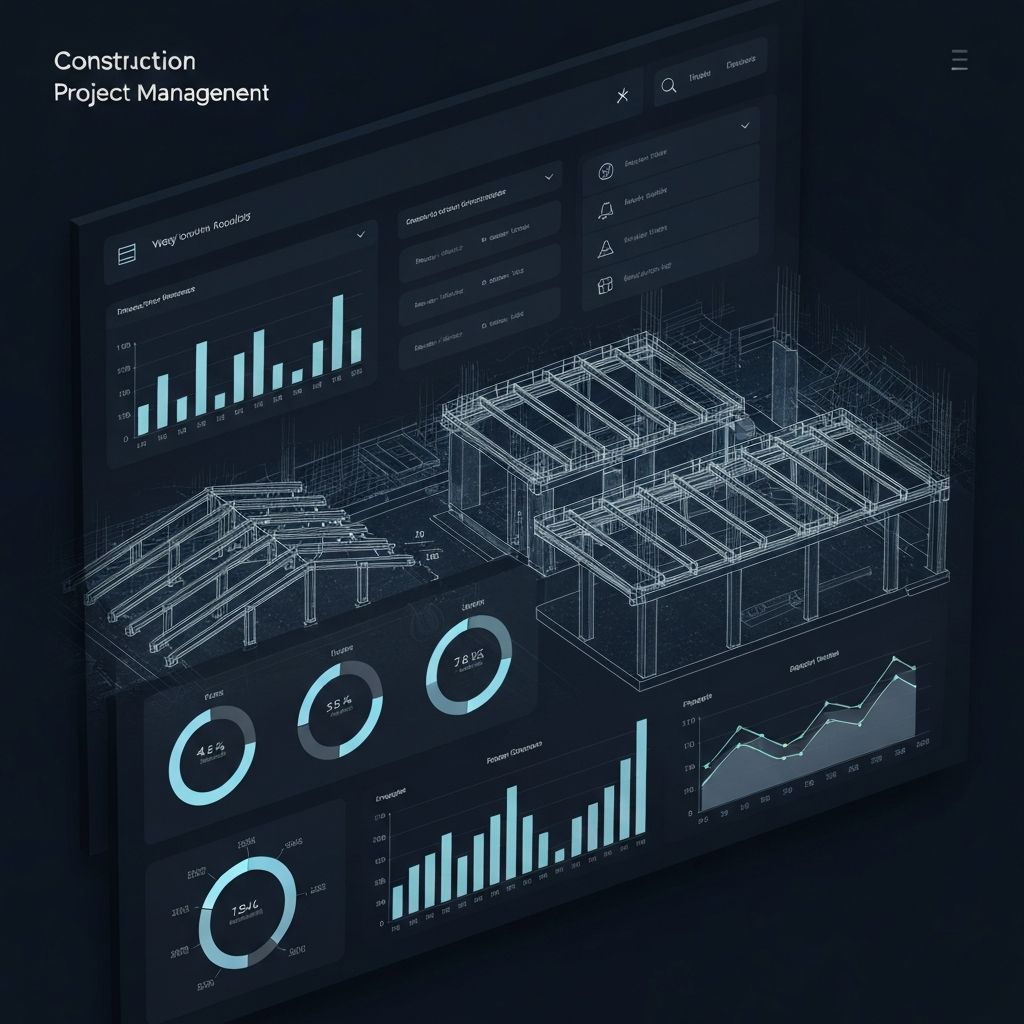
Regional Construction Group
South East Queensland
Project managers each maintained their own Excel files for tracking costs and schedules. Head office had no visibility into company-wide performance until month-end close. Cost overruns were discovered too late to correct.
Root Cause
Decentralised data with no standard templates or definitions. Project managers resistant to change because previous 'systems' had failed. No trust in central reporting.
What We Built
Worked with project managers to design templates that matched their workflow. Built a lightweight data collection process that minimised their effort. Created dashboards that gave PMs better visibility while rolling up to company-wide views.
Outcomes
- Unified project tracking across all active sites
- Real-time cost and schedule performance visibility
- Early warning system for potential overruns
- Project managers now advocate for the system

Regional Healthcare Provider
Regional Queensland
Clinical managers spent hours each week manually compiling patient flow reports. Data was scattered across multiple clinical systems with no integration. Staffing decisions were reactive rather than proactive.
Root Cause
Multiple clinical systems with no data warehouse. Manual extraction and Excel manipulation was the only way to get a complete picture. IT had attempted integration projects that stalled.
What We Built
Built a focused data model connecting the core patient management and staffing systems. Implemented automated extracts that respected data governance requirements. Created operational dashboards for ward managers and strategic views for leadership.
Outcomes
- Managers reclaimed 6+ hours per week
- Proactive staffing based on predicted patient volumes
- Clinical meetings now focus on action, not data gathering
- Foundation for expanding to other clinical metrics

Multi-Location Retail Group
Queensland & NSW
Store managers had no visibility into their performance beyond basic POS reports. Head office reports were designed for executives and ignored by store teams. Previous BI implementation had 5% adoption.
Root Cause
Dashboards designed without store manager input. Reports showed metrics managers could not influence. Mobile access was poor, and stores had limited desktop access.
What We Built
Co-designed with store managers to identify metrics that mattered to them. Built mobile-first dashboards optimised for quick checks during shifts. Connected incentive metrics to help managers track their own performance.
Outcomes
- Adoption jumped from 5% to over 90%
- Store managers check dashboards multiple times daily
- Regional managers use data in store visits
- Head office reports now trusted and acted upon
Dashboard gallery
Examples of the types of dashboards we build. Actual client dashboards are confidential.
Executive Summary
High-level KPIs with drill-through capability
Sales Performance
Revenue, pipeline, and conversion tracking
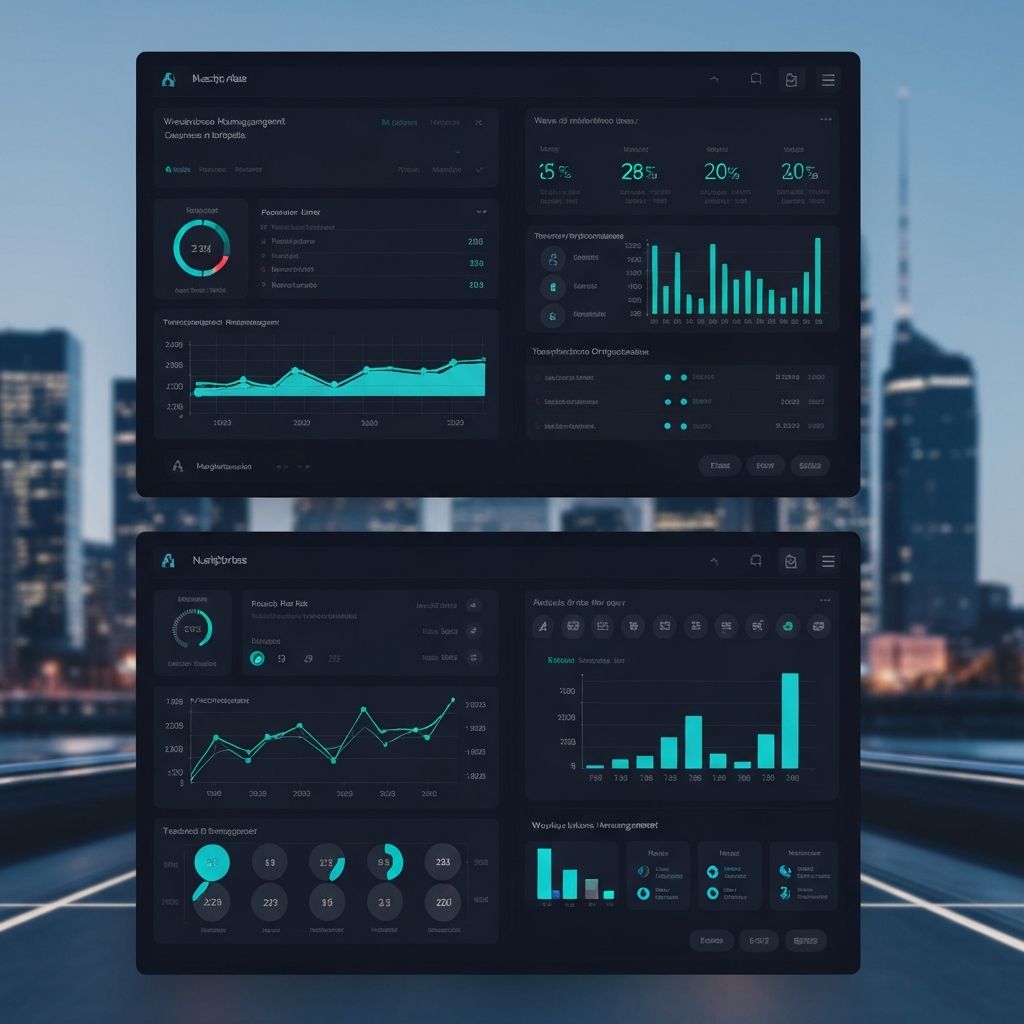
Operations Dashboard
Efficiency metrics and resource utilisation
Financial Reporting
P&L, cash flow, and budget variance
Industries we serve
Experience across the sectors that drive the Australian economy.
Ready to become our next success story?
Book a free discovery call. We will discuss your challenges and show you what is possible.
Book Your Discovery Call